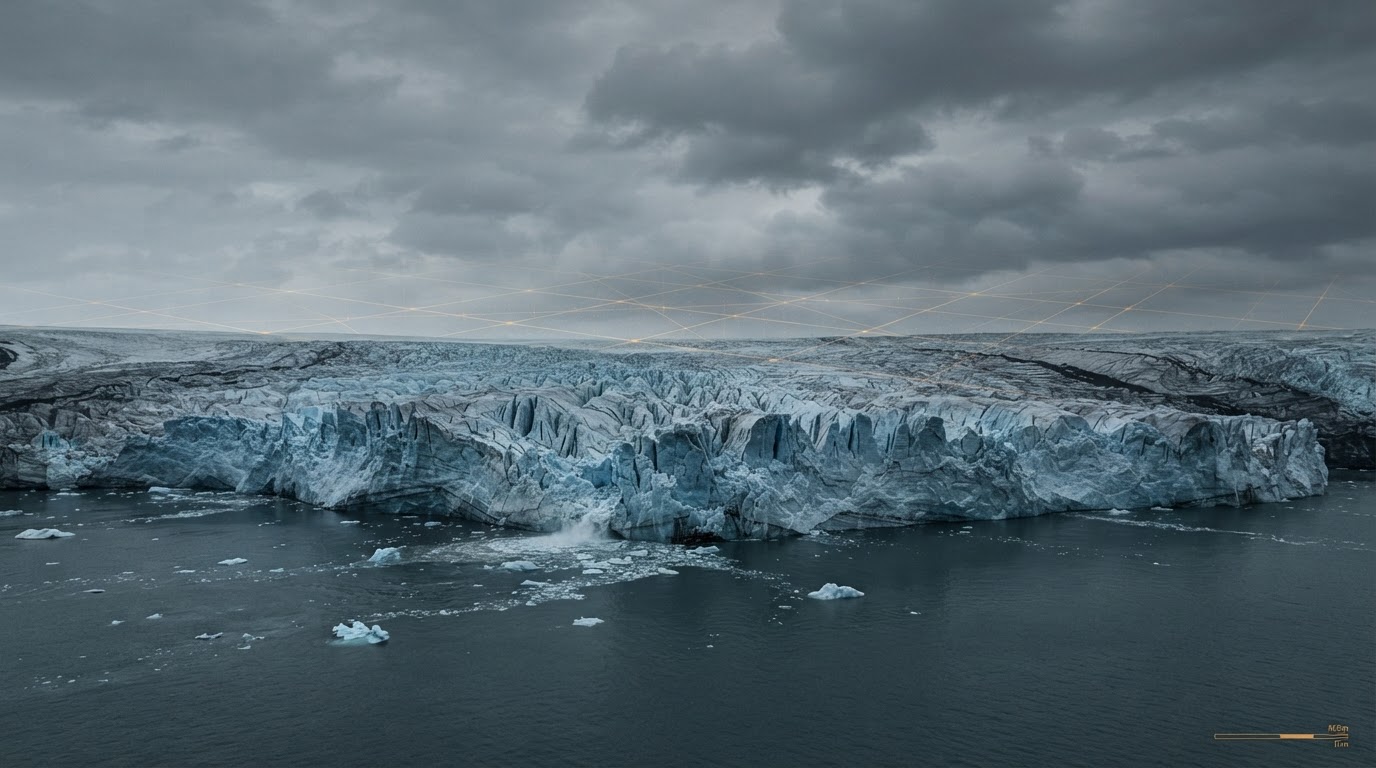
The longest continuous satellite record of ice-sheet change yet assembled was published on 16 September 2026 in the Nature journal Scientific Data, and its central numbers are unusually easy to state. According to the Northumbria University announcement, Greenland and Antarctica together lost 11,309 billion tonnes of ice between 1979 and 2023, which pushed global sea level up by 31.4 millimetres, or just over an inch and a fifth. The same release reports that 84 per cent of that combined loss came from glaciers speeding up and discharging more ice into the ocean, while 16 per cent came from melting at the surface of the ice sheets.
The record itself is the product of the Ice Sheet Mass Balance Inter-comparison Exercise, a long-running international collaboration that reconciles measurements from different satellite systems instead of relying on any single mission. The team combined 42 independent surveys drawing on 27 satellite missions, and used the early Landsat archive to reach back to 1972 for Greenland and 1979 for Antarctica. Northumbria says the assessment was led by Dr Inès Otosaka and Professor Andrew Shepherd at Northumbria, together with Dr Tyler Sutterley of the University of Washington Applied Physics Laboratory, with support from the European Space Agency and NASA.
What the satellite record actually measures
The European Space Agency’s account of the results breaks the sea-level contribution into its two parts, attributing 1.81 centimetres to Greenland and 1.33 centimetres to Antarctica, and notes that the two ice sheets are now responsible for roughly a quarter of global sea-level rise. Greenland was close to balance in the 1970s, with gains and losses roughly matched, and its annual loss then rose from about 60 billion tonnes in the 1980s to 264 billion tonnes in the 2010s. Antarctica followed a similar path, from about 48 billion tonnes a year in the 1980s to 202 billion tonnes in the 2010s, with its net loss driven by ocean-driven melting and the acceleration of outlet glaciers.
Dr Otosaka is quoted by Northumbria as saying that reaching back to the 1970s allows researchers to see half a century of change, and that more than four-fifths of the ice lost was discharged into the ocean by faster-flowing glaciers rather than melted at the surface, which she describes as evidence that the long-term trend reflects the dynamic response of the ice sheets to a warming ocean. New Scientist reported the same split and added that total loss has sped up roughly fourfold since the 1980s, with the glacier-flow share of that acceleration described as a much higher proportion than researchers had expected.
One detail in the ESA summary received far less attention in the day’s coverage. Between 2020 and 2023 the overall rate of loss slowed, because unusually heavy snowfall across East Antarctica offset some of the losses from glaciers elsewhere, and a run of milder Greenland summers roughly halved the amount of ice lost to surface melting. ESA is careful to say that scientists treat this as short-term variability rather than a reversal, and the release also states that high-end estimates of sea-level rise by 2150 increase by a factor of 2.6 once the risk of ice-sheet instability is included. Both statements belong in the same story, and a reader is entitled to see them together.
Why the reported totals diverge
How the outlets framed it
ESA and Northumbria both led with 11.3 trillion tonnes lost since the 1970s and with glacier discharge as the dominant mechanism, naming the 84 per cent to 16 per cent split explicitly. The Los Angeles Times, running wire copy, headlined more than 12 trillion tons over 47 years and told readers that five-sixths of the melt came from warmer water rather than hotter air. The larger figure is the same measurement expressed in US short tons, which that story acknowledges in parentheses, and the “47 years” covers 1979 to 2026 rather than the 1979 to 2023 measurement window. The mechanism has also been recast: the paper’s finding concerns ice discharged by accelerating glaciers, which is a flow process, and translating that directly into “warmer water” imports a cause that the mass-balance record does not itself measure.
The Los Angeles Times version is not wrong on arithmetic, and it gives the metric figure alongside the imperial one. The difficulty is that a reader comparing headlines across outlets sees two different totals and two different explanations for the same paper, and has no easy way to tell that one is a unit conversion and the other is an interpretation layered on top of the measurement. Agencies that fund and publicise this work have an interest in the strongest possible framing of their own results, which is precisely why the plain numbers in the published record are the more useful thing to read.